

Latest Group news
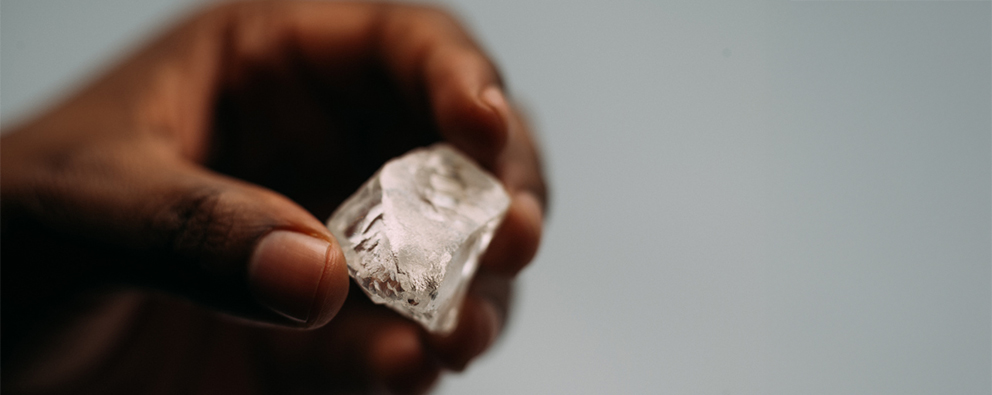
De Beers - Diamonds
|
Diamonds(1) (000 carats) |
Q2 |
Q2 |
Q2 2026 vs. |
Q1 |
Q2 2026 vs. |
H1 |
H1 |
H1 2026 vs. |
|
Botswana |
5,488 |
2,651 |
107% |
4,814 |
14% |
10,302 |
7,223 |
43% |
|
Namibia |
531 |
535 |
(1)% |
556 |
(4)% |
1,087 |
1,166 |
(7)% |
|
South Africa |
734 |
592 |
24% |
740 |
(1)% |
1,474 |
1,075 |
37% |
|
Canada |
1,028 |
361 |
185% |
1,023 |
(0)% |
2,051 |
750 |
173% |
|
Total carats recovered |
7,781 |
4,139 |
88% |
7,133 |
9% |
14,914 |
10,214 |
46% |
(1) Production is on a 100% basis, except for the Gahcho Kué joint operation which is on an attributable 51% basis.
Operational Performance
Rough diamond production was 88% higher at 7.8 million carats, reflecting the impact of the extended maintenance shutdown in the comparative period at Orapa in Botswana, as well as the planned mining of higher-grade ore at both Jwaneng in Botswana and Gahcho Kué in Canada. Planned plant maintenance at Orapa and Jwaneng during the second half of the year is expected to substantially decrease production levels from current rates.
In Botswana, production increased to 5.5 million carats, due to the impact of the extended maintenance at Orapa in the comparative period as well as the planned mining of higher-grade ore at Jwaneng to optimise plant throughput.
Production in Namibia was broadly unchanged at 0.5 million carats. The retirement of the Coral Sea vessel in the comparative period and planned maintenance of the Mafuta vessel at Debmarine Namibia were largely offset by the planned mining of higher-grade areas at Namdeb.
In South Africa, production at Venetia increased to 0.7 million carats, largely as a result of processing higher volumes of underground ore. As announced by De Beers on 13 July 2026, a pause in production at Venetia is proposed to start in the second half of the year.
In Canada, production increased to 1.0 million carats, as Gahcho Kué benefited from the planned processing of higher-grade ore from the new mining area.
Trading Performance
Rough diamond trading conditions remained challenging in the first half of 2026. The geopolitical and macroeconomic landscape remains uncertain, with the onset of the conflict in the Middle East adding to economic and consumer confidence risks. Synthetic lab-grown diamonds also continued to affect demand for lower value natural diamonds adding pressure in more price-sensitive categories. However, stronger pricing for higher value goods supported a stable overall average price index throughout the period.
The H1 2026 consolidated average realised price declined by 32% to $105/carat, as a result of both a sales mix with a higher proportion of lower value goods due to the current inventory mix and a 16% decrease in the average rough price index (which is now reported including the impact of the stock rebalancing actions taken throughout 2025).
Rough diamond sales in Q2 2026 totalled 7.1 million carats (6.0 million carats on a consolidated basis)(1) from three Sights, generating consolidated rough diamond sales revenue of $665 million. This compares with three Sights in Q2 2025 of 7.6 million carats (6.8 million carats on a consolidated basis)(1), generating $1.2 billion of consolidated rough diamond sales revenue.
2026 Guidance
Production(2) guidance for 2026 is unchanged at 21–26 million carats (100% basis), as the impact of planned plant maintenance at Orapa and Jwaneng and the proposed production pause at Venetia in the second half is expected to reduce the full year production run-rate. De Beers continues to monitor rough diamond trading conditions in order to align output with prevailing demand.
Unit cost guidance for 2026 is unchanged at c.$80/carat(3).
(1) Consolidated sales volumes exclude De Beers Group’s JV partners’ 50% proportionate share of sales to entities outside De Beers Group from the Diamond Trading Company Botswana and the Namibia Diamond Trading Company, which are included in total sales volume (100% basis).
(2) Production is on a 100% basis, except for the Gahcho Kué joint operation which is on an attributable 51% basis.
(3) FX rate assumption for 2026 unit costs of c.16.50 ZAR:USD (previously c.16.00 ZAR:USD).
| Diamonds(1) | Q2 2026 |
Q1 2026 |
Q4 2025 |
Q3 2025 |
Q2 2025 |
Q2 2026 vs. Q2 2025 | Q2 2026 vs. Q1 2026 | H1 2026 |
H1 2025 |
H1 2026 vs. H1 2025 |
| Carats recovered (000 carats) | ||||||||||
| 100% basis (unless stated) | ||||||||||
| Jwaneng | 2,789 | 2,232 | 0 | 3,151 | 1,859 | 50 % | 25 % | 5,021 | 4,108 | 22 % |
| Orapa(2) | 2,699 | 2,582 | 1,881 | 2,879 | 792 | 241 % | 5 % | 5,281 | 3,115 | 70 % |
| Total Botswana | 5,488 | 4,814 | 1,881 | 6,030 | 2,651 | 107 % | 14 % | 10,302 | 7,223 | 43 % |
| Debmarine Namibia | 370 | 354 | 286 | 303 | 385 | (4) % | 5 % | 724 | 846 | (14) % |
| Namdeb (land operations) | 161 | 202 | 173 | 154 | 150 | 7 % | (20) % | 363 | 320 | 13 % |
| Total Namibia | 531 | 556 | 459 | 457 | 535 | (1) % | (4) % | 1,087 | 1,166 | (7) % |
| Venetia | 734 | 740 | 496 | 659 | 592 | 24 % | (1) % | 1,474 | 1,075 | 37 % |
| Total South Africa | 734 | 740 | 496 | 659 | 592 | 24 % | (1) % | 1,474 | 1,075 | 37 % |
| Gahcho Kué (51% basis) | 1,028 | 1,023 | 949 | 511 | 361 | 185 % | 0 % | 2,051 | 750 | 173 % |
| Total Canada | 1,028 | 1,023 | 949 | 511 | 361 | 185 % | 0 % | 2,051 | 750 | 173 % |
| Total carats recovered | 7,781 | 7,133 | 3,785 | 7,657 | 4,139 | 88 % | 9 % | 14,914 | 10,214 | 46 % |
| Total sales volume (100%) (000 carats)(3) | 7,061 | 7,723 | 5,941 | 5,715 | 7,555 | (7) % | (9) % | 14,784 | 12,270 | 20 % |
| Consolidated sales volume (000 carats)(3) | 6,038 | 6,408 | 5,383 | 4,558 | 6,815 | (11) % | (6) % | 12,446 | 11,005 | 13 % |
| Consolidated rough diamond sales value ($m)(4) | 665 | 648 | 571 | 700 | 1,185 | (44) % | 3 % | 1,313 | 1,705 | (23) % |
| Average price ($/ct)(5) | 110 | 101 | 106 | 154 | 174 | (37) % | 9 % | 105 | 155 | (32) % |
| Average price index(6) | 69 | 68 | 74 | 81 | 83 | (17) % | 1 % | 69 | 82 | (16) % |
| Number of Sights | 3 | 2 | 3 | 2 | 3 | 5 | 5 |
(1) Production is on a 100% basis, except for the Gahcho Kué joint operation which is on an attributable 51% basis.
(2) Orapa constitutes the Orapa Regime which includes Orapa, Letlhakane and Damtshaa. Letlhakane was placed on care and maintenance in March 2025, and Damtshaa has been on care and maintenance since 2021.
(3) Consolidated sales volumes exclude De Beers Group’s JV partners’ 50% proportionate share of sales to entities outside De Beers Group from the Diamond Trading Company Botswana and the Namibia Diamond Trading Company, which are included in total sales volume (100% basis).
(4) Consolidated rough diamond sales value includes De Beers Group's 50% proportionate share of sales to entities outside De Beers Group from Diamond Trading Company Botswana and the Namibia Diamond Trading Company.
(5) Consolidated average realised price based on 100% selling value post-aggregation.
(6) Average of the De Beers price index for the Sights within the period. The 2025 indices have been restated to include the effect of the stock rebalancing actions. The De Beers price index is relative to 100 as at December 2006.